Mapping a community’s needs and resources is one of the first things that many community groups do, when beginning their journey into local change-making. See also this post from the Transition Network that positions community mapping within the context of lots of other “ingredients” needed for community change-making (The term ‘ingredients’ is the Transition term for patterns in pattern language).
Listed below are mainly UK maps and some global ones. There are maps that locate Timebanks, Cooperatives, community assets and community groups as well as local producers, growers or retailers, independent businesses of all kinds, organics, places for foraging and permaculture projects. There are also some great maps on regional soil types or wind speeds, cycle routes or typical farming, the potential for sea level rise and there’s even a bunch on local statistics maps with figures for things like economic trade and many more.
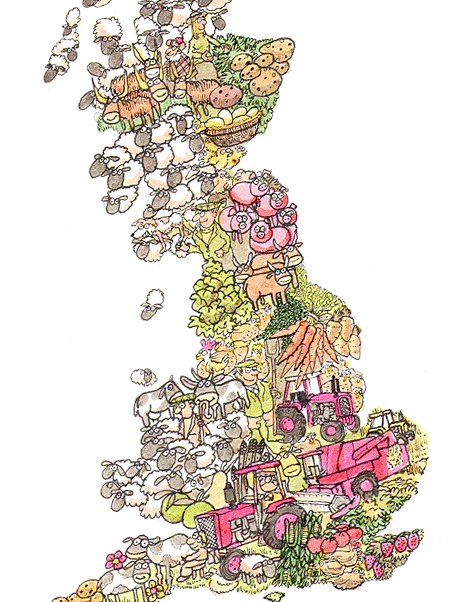
See the changing faces of farming. On this map of England, Scotland and Wales you can see how different parts of the country concentrate on different types of farming e.g. sheep farming in Wales.
Search the map to find a match, contact matched Landsharers and see how they are working together, search for helpers or local growers, or simply contact people in the wider Landshare community. There’s also a landshare app available.
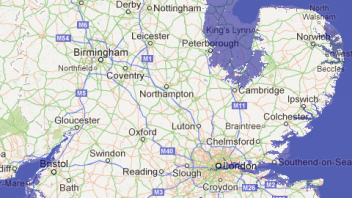
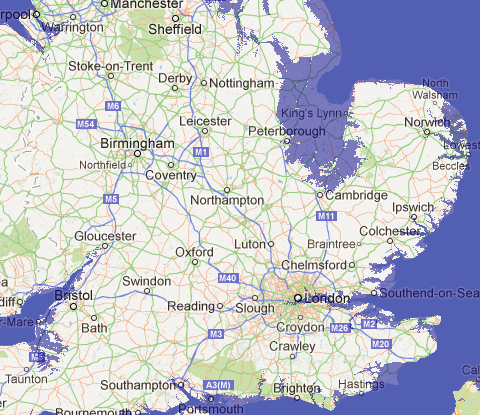
Use the drop down menu in the top right hand side to vary the height of sea level rise and view possible impacts in your area.
Find your local producers. We help people to find good, safe, accountable food from local sources.

World Wide Permaculture Project
This is a growing list of permaculture projects worldwide. It will be the premier place to find out who is doing what, and where, in the permaculture world. You can search for projects by keyword, and/or filter to specific project types. You can even constrain your search by climate zone, so you can find others working in the same conditions.
The Global Transition to a New Economy
A map of innovative projects that challenge business as usual and contribute to the systemic change to our economy that we urgently require. Together, these projects create a world that prioritizes human wellbeing, within environmental limits. It is a project of the New Economics Institute, the new economics foundation, Stakeholder Forum for a Sustainable Future and the Green Economy Coalition.

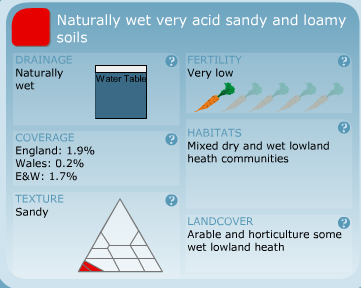
Soilscapes conveys a summary of the broad regional differences in the soil landscapes of England and Wales. Soilscapes is not intended as a means for supporting detailed assessments, such as land planning applications or site investigations; nor should it be used to support commercial activities. For such applications, a parallel service Soils Site Reporter provides comprehensive reporting for specific locations. More detailed Soil datasets are also available for lease from NSRI.
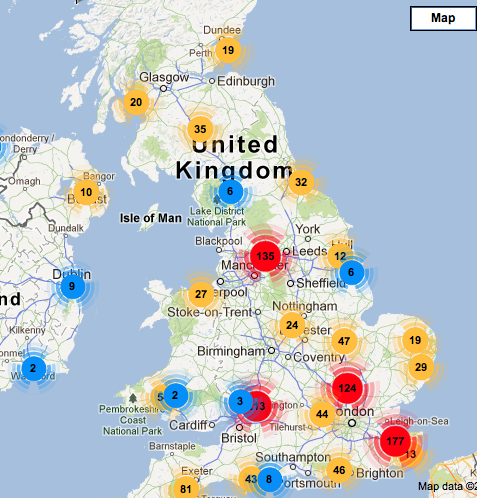
Transition Initiatives, People and Projects
This is the Big Transition Map, showing all people, initiatives and projects working in Transition across the world. It’s quite busy in some places so be sure to zoom in to see all the initiatives.
Makes it easy for people to find co-operatives and mutuals across the UK. Whether they need food or phones, electricity or banking, Co-operate allows customers to access a better world. There’s also the mobile phone app version.

From town halls to village halls, castles to car parks, community assets can be the cornerstone of a thriving local community. By bringing together assets, ideas and people, The Place Station helps you to transform existing land and buildings into new, vibrant community spaces.

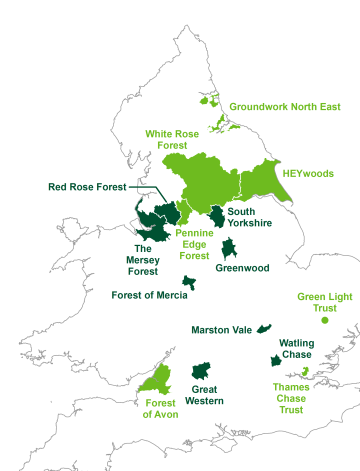
To discover more about your local Community Forest, click on its name on the map
Discover ways to connect with community food projects in your local area.

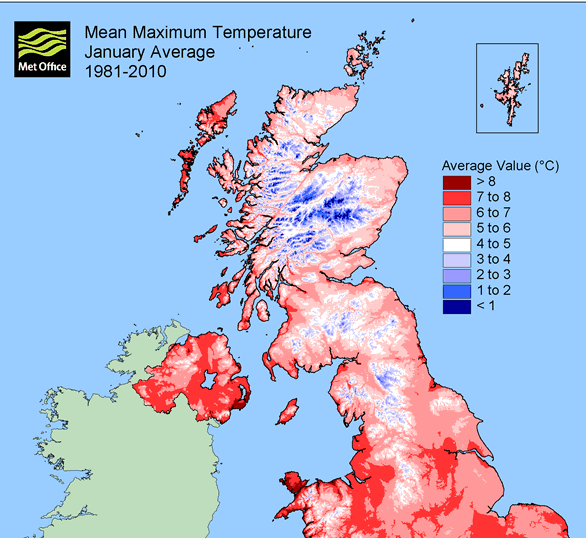
Met Office UK Climate Global Averages
Select the information below to view UK maps of monthly, seasonal and annual averages. The analyses are based on 1 km grid-point data sets which are derived from station data covering the 30-year averaging periods, 1961–1990, 1971–2000 and 1981–2010. Rainfall maps include all precipitation (rainfall, snow and hail).
We help you find new trade partners, re-localise, and access real-time opportunities. It’s a professional network serving every type of food business, from farm to fork, at every scale and turnover.

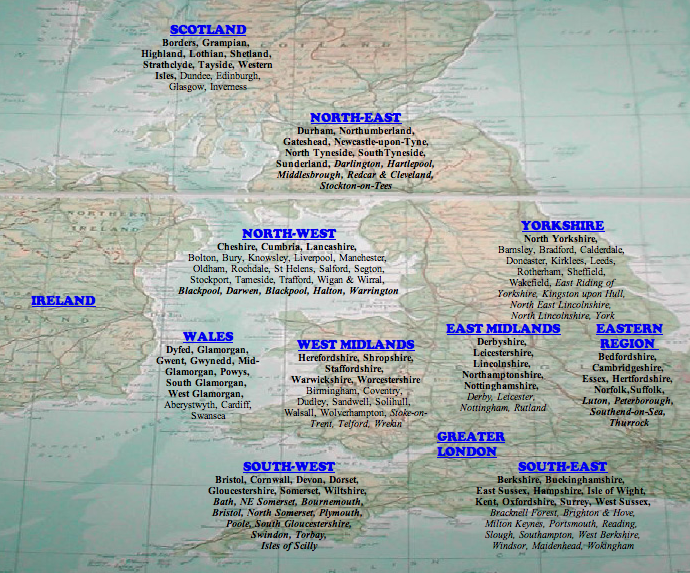
Such is the interest from our enquirers that to meet the demand, we maintain a full set of links to local schemes, as soon as we can verify information from individual LETS organisers. Please follow the links from the regional headers to obtain local contacts.
User driven map showing places to forage across the globe.

The Fruit trees will appear below. Use the controls to zoom and click and drag around the map. Click on a tree icon to view its description and particular details. Some trees have more information than others. This is down to the amount of information we receive from the public mapping team; You.
Use the interactive map to discover case studies, factsheets and events in your region. Farming Futures can help you prepare for the impacts of climate change and the opportunities for your business. A great place to start looking for information is our library of fact sheets. Fact sheets one to four are a great introduction to what climate change is, how it will affect agriculture and how you can prepare and respond.
Willing Workers On Organic Farms (WWOOF)
Map showing all locations mentioned in the linked article.

3TIER, Inc., as part of their ‘REmapping the World Initiative’, has developed a 5 km resolution global wind map. To produce the map and dataset, 3TIER implemented an innovative physical-statistical model, and ran the model through a 10-year simulation.

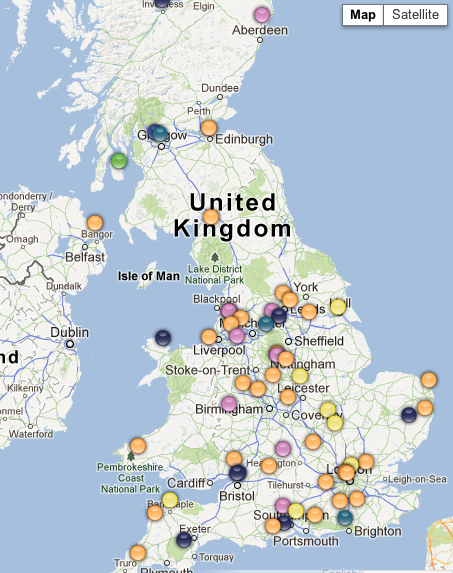
There are now well over 250 timebanks across the UK. To find out how you can get involved in one near you, search the database by entering your address or an area of interest. When you have found a timebank, click on the google-map pin to find out more information about it.
Office of National Statistics (ONS)
There’s a significant list of different ONS maps available from the link above.
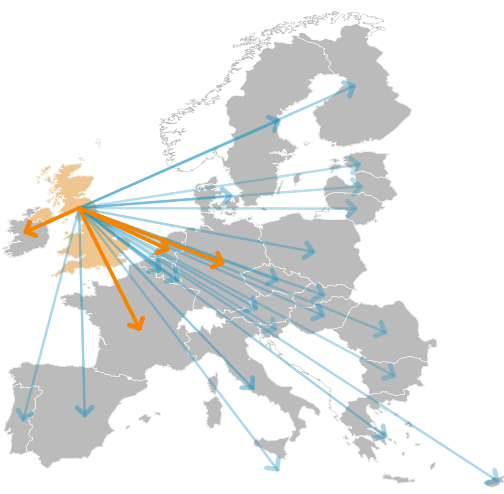
For example check out this interactive application allows you to view UK Trade in Services (excluding Travel, Transport and Banking) with our EU27 partners as a ‘flow map’, drawing lines on the map to represent movement of goods.
Find out what’s good where you are – we’ll show you where to find your local food and produce suppliers. From fresh fish to organic lemon curd, our UK database of over 6,000 outlets will satisfy any shopping list. So support your local trade and get searching!
This World View Map combines all of the Open Green Maps! Zoom in to see thousands of green sites charted by local Green Mapmakers.

The Business for Good Map is your tool to learn where and how companies invest in creating a better, more sustainable world. Explore. Share.

The Guardian’s local shopping map: add your photos and Twitter reviews. Browse the latest photos and tweets from local shoppers in the UK and beyond with our interactive map
LocalPower is an easy way to find groups, and for groups to be found, dealing with the climate, energy and environmental crises through practical action and/or campaigning.

Sustrans cycle route map. The Sustrans shop also stocks a wide range of products for the everyday cyclist.
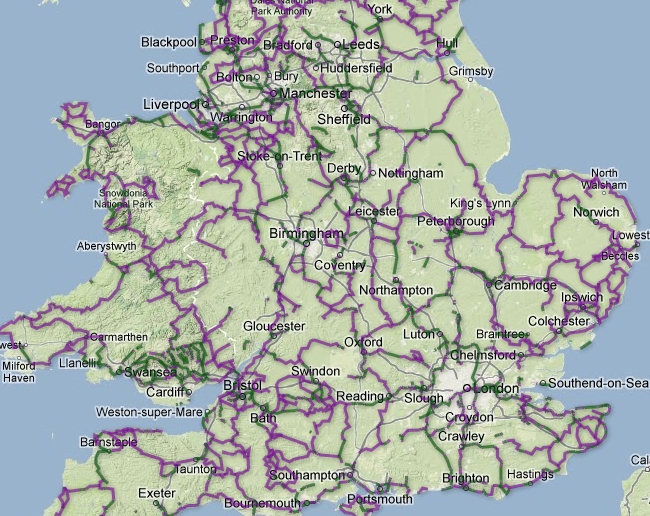
Some maps still in development phase
The Center for Innovative Technology (CIT) announced today an investment in Oakton, Va.-based Villagize, a social networking website that connects people in their local residential community.
Our dream is to tap individual ambition for the public good..to renew our world by enabling all of us to renew our lives, and our neighborhoods. We think of recitizens–our members–as the “entrepreneurs of paradise.”

Here’s a great example of a type of map you might like to make for your local community
The Todmorden clickable egg map, shows where surplus eggs are available






Empire and Enclosure relied on maps. Reclaiming the Commons also relies on good mapping skills, so thanks for these inspiring examples!
Another crucial piece for me is using web-based maps during a community development process.
For instance, those planning to introduce a local currency could encourage the four key economic players in their community – individuals, businesses, voluntary groups and local government – to list their underused assets and unmet needs on a website early in the development process. This will build up a great buzz of expectation long before launch so you can make the most of the ‘media moment’ then.
Once a critical mass of these players have signed up, then launch the currency.
Thanks John! Slightly different from what you’re suggesting, but on a similar mapping of under utilised assets, I particularly like streetbank an online mapping tool for sharing those assets. there’s sooooo many things that mapping can be used for!
here’s a couple more mapping tools;
land registry – enter post code to find out who owns land https://eservices.landregistry.gov.uk/www/wps/portal/!ut/p/b1/04_Sj9CPykssy0xPLMnMz0vMAfGjzOKNjSxMDA1NjDwsjM3MDTxN3dyNDUNMjQ2CDfWDU_P0C7IdFQE7wI6O/
flood risk map
http://maps.environment-agency.gov.uk/wiyby/wiybyController?x=357683.0&y=355134.0&scale=1&layerGroups=default&ep=map&textonly=off&lang=_e&topic=floodmap
Open access maps mapping commons (not including village greens)
http://www.openaccess.naturalengland.org.uk/wps/portal/oasys/maps/MapSearch